The October 2019 update for Power BI Desktop has landed, this one includes an incredible new visual called the Q&A Visual. This visual will allow report designers to give a much better Q&A experience to end-users and being a visual it can interact, cross filter, support bookmarks and be themed just like any other visual!
Here’s the complete list of October updates:
Reporting
- Automatic page refresh for DirectQuery (preview)
Analytics
- The new Q&A visual
- Improved user experience for Q&A
- Improved drop-down control
- Red/Blue underlines
- Improved visual results
- Natural Language improvements for Q&A
- Integration with office/Bing thesaurus
- Support for measure tables & better handling of table names and ambiguity
- Row label and synonyms support inside Modelling pane
- Q&A tooling (Preview)
- Review questions
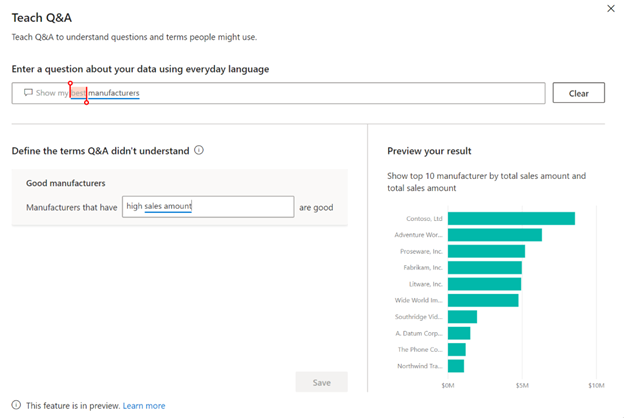
- Teach Q&A
- Review all changes made
- Support for SSAS and Azure AS including RLS
Visualizations
- PowerApps visual is now included by default
- New xViz visuals
- Hierarchical Variance Table
- Linear Gauge
- Tag Cloud
Data connectivity
- Sagra Emigo connector generally available
- Azure Cost Management connector updated
- New Workplace Analytics connector
Data Preparation
- Query diagnostics
- Data profiling enhancements
Template Apps
- Project Web App
Other
- New file format: .pbids
- Performance improvements for modeling operations
For a summary of the major updates, you can watch the following video:
For more Power BI updates head over to Microsoft’s official blog and sign up to our newsletter!