Why do I want a Power BI Template file?
If you want reports to have an impact on users, build a great user experience into your Power BI template and report. At the heart of delivering a great user experience is making sure users can navigate around Power BI reports. You need to ensure they can move around quickly and cleanly avoiding situations where you overwhelm them with data.
I start all of my reports with a “base file”. This is a Power BI Template built in a PBIX file that I’ve pre-loaded a solid user experience into by combining Microsoft Power BI with PowerPoint.
By starting with the same base file, you can save heaps of time usually spent on adding bookmarks, designing layouts and even teaching your end users. When I start working with a client, I simply clone my base file and theme it with their colours, backgrounds and logos.
Part 1: PowerPoint Backgrounds
Step 1
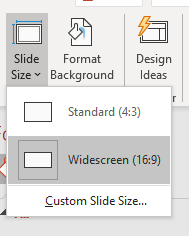
Open PowerPoint and create a Blank Presentation. Navigate across to the Design tab and set your Slide Size to be the same as your Power BI Report. I like to use 16:9 landscape for online viewing or A4 portrait style for detailed reports that get printed.
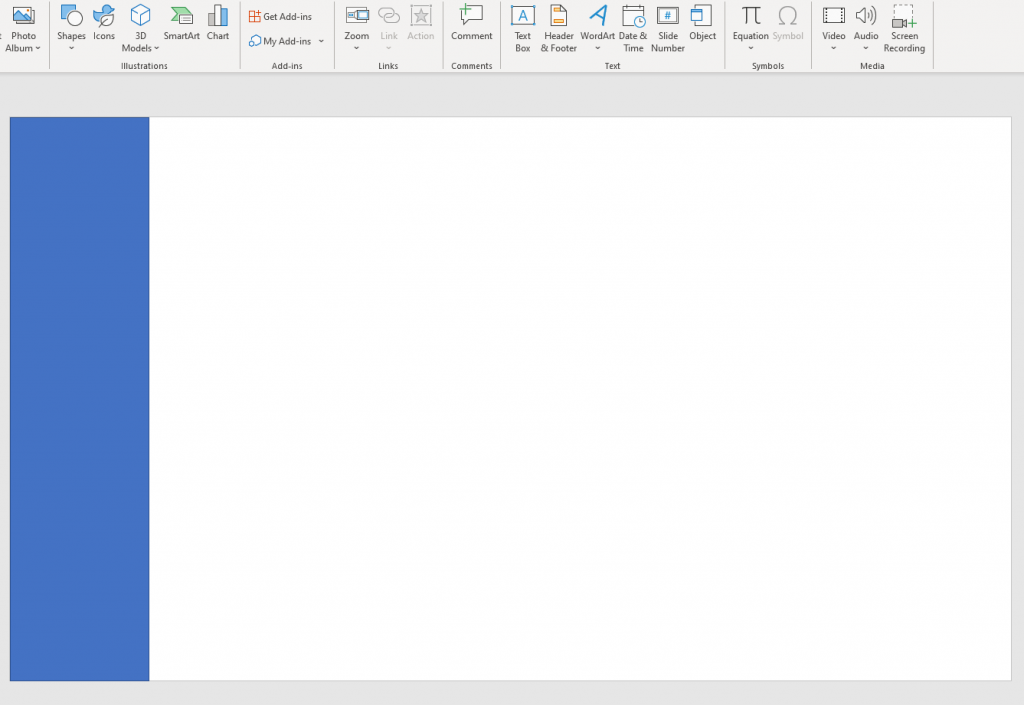
We are going to use this presentation to generate image files to use as backgrounds to our Power BI report. So start by deleting the text boxes that PowerPoint automatically brings in so we have a completely blank page.
Step 2
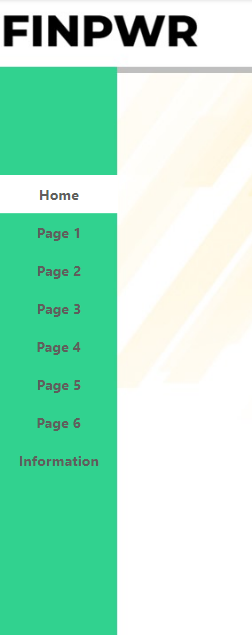
We need to create some key base elements to support our Power BI base file being a Navigation panel, Slicer panel and Visuals section. First identify an area for navigation, I recommend using the left side of the report for your standard landscape reports or the top side if you’re planning a portrait style report.
We do this by going to Insert, then Shapes, selecting the Rectangle Tool and placing a box along one side of the slide.
Step 3
The next key element we need is an area for our Slicers in Power BI. Let’s place a similar rectangle or even just a neat line along one of the sides to act as a Slicer “panel”.
It’s important to isolate and manage the area we use for Slicers. It’s easy to get caught adding filters to everything and end up with a Power BI report that has half the space taken up with Slicers!

Step 4
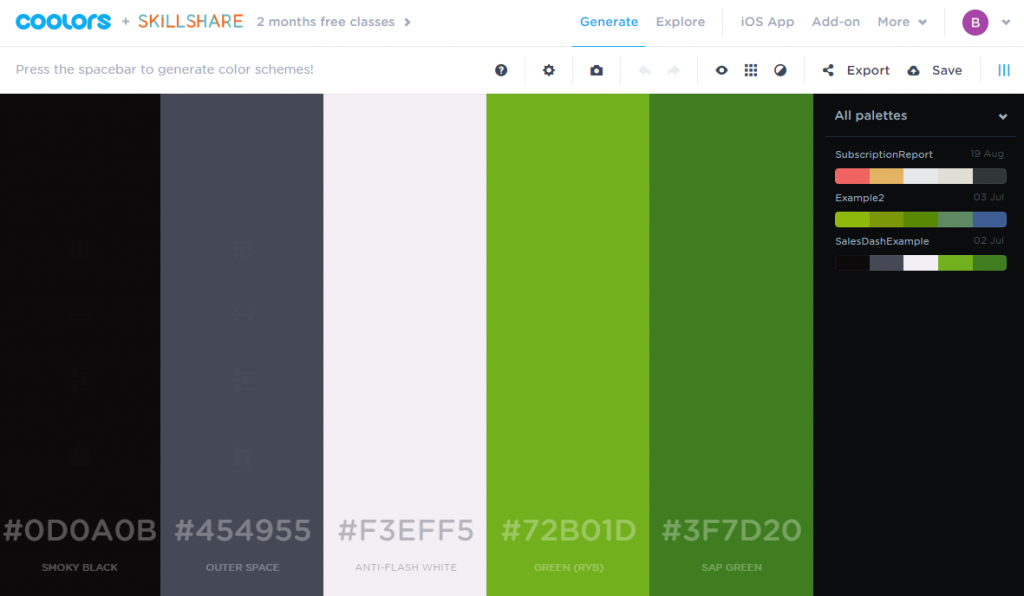
Now we can add a logo to the slide, as well as colour up our rectangles/lines to suit our users. I like using Coolors.co to generate a pallet of colours that I can use in my report.
Either start by uploading an image to Coolors or choosing one or two base colours (eg from the client’s logo). Then just let Coolors generate some complimentary colours you can use in your report.

Step 5
Let’s make this really pop by incorporating a semi-transparent image into the background!
First find an image, logo or icon and save a copy of it. Then in PowerPoint use the Insert tab and click Pictures to insert your image. Once positioned, right click on the picture and click Format Picture to open up some design options. Look for a Picture icon called Picture Transparency, which I’ll set to 75%.

Step 6
Now that we have a solid starting point for background, let’s build out some logical layouts to help position our visuals.
Duplicate your slide and go to Insert along the top ribbon and click Table. Let’s start with a 2×2 table and create a layout with 4 boxes. Use the Table Design ribbon to remove the table background and add All Borders. Now resize your table so that it covers your section for visuals. Your slide should look something like this:

Step 7
Now that you have developed your layouts, let’s export image versions of each slide by going File, Export and Change File Type selecting JPEG Format and then Save As. You should be prompted to either save one slide or All Slides which conveniently exports all slides into separate images.
There you have it, you now have a nice background image for your Power BI template! Let’s move on to Part 2 and build out your report navigation.
Part 2: Power BI Report Navigation
Step 1
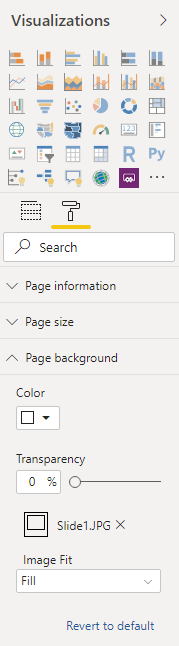
Open a blank PBIX file to kick off our Power BI Template. Navigate to the “paint roller” or Format option under the Visualizations pane and open up Page background. Click add image and load one of our PowerPoint image files in, then set Transparency to 0%. Finally set the Image Fit to Fill to ensure your image takes up the entire report background.
Step 2
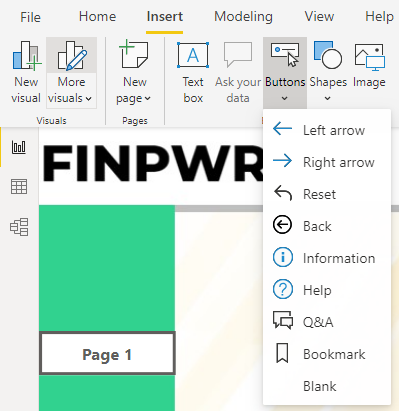
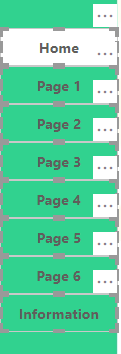
With our background now set and report looking great, let’s add in some navigation buttons. Along the top under the Insert ribbon, add a Blank button. Resize and position your bottom along your designated navigation section. Using the Visualizations pane, add Button Text and format to your heart’s content!
Add as many buttons as you need for your report (1 per page), keeping them all the same format. In my example, I use a bold, larger font with no borders and background turned off.
Step 3
With all of our buttons added, we can now duplicate this page as many times as needed. With each page we can go in and change the background image to suit the layout need.
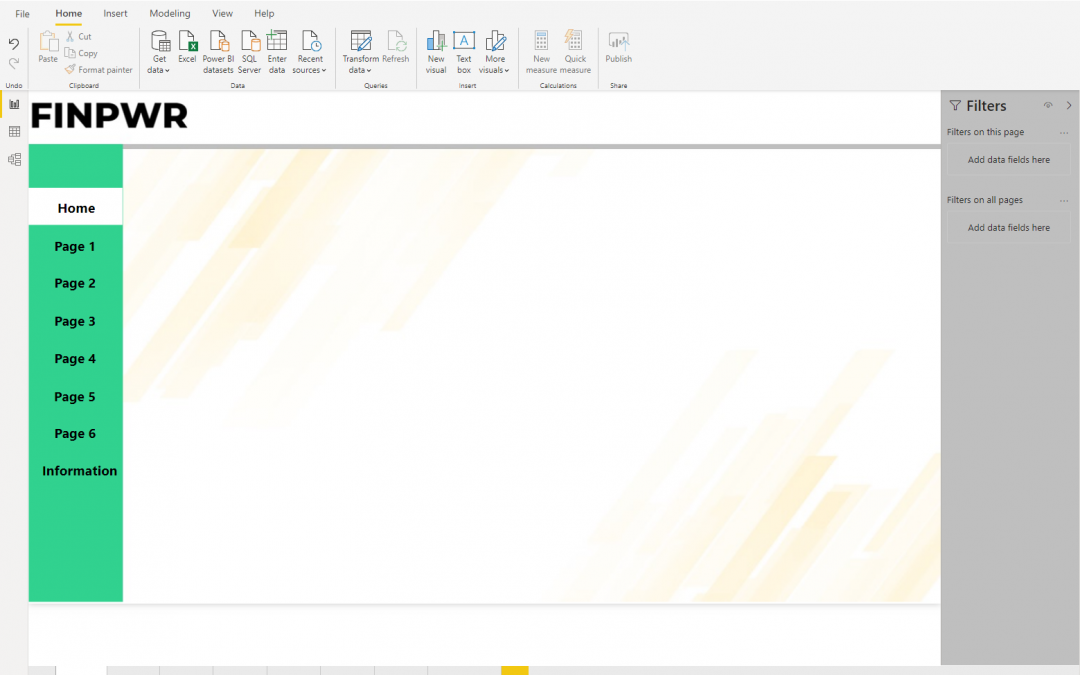
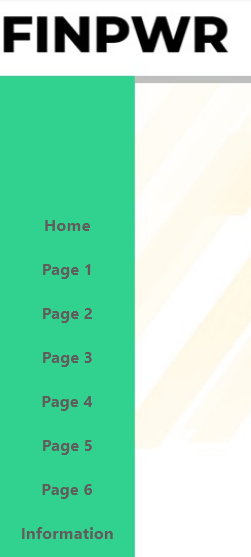
As a starting point, I like a Home page, 6 pages with different layouts and lastly an Information page. The information page is used to provide users with key definitions, last update/refresh time and a link to supporting documentation.

Step 4
Now it’s time to add bookmarks. Under the View ribbon, make your Bookmarks pane visible. For each page we need to add a bookmark and rename it to the corresponding report page title.
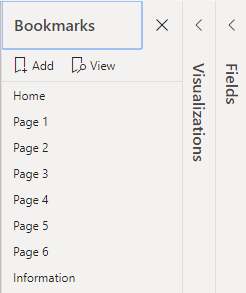
Once added, test your bookmarks out by Viewing them to see how you can move around the report.
Step 5
With our bookmarks and buttons in place, we just need to add an Action to each button. Select the Home button and under the Visualizations pane turn Action to On. Change the Type to Bookmark and select the Home bookmark you created. Rinse and repeat for all your buttons giving them the relevant Bookmark Action.
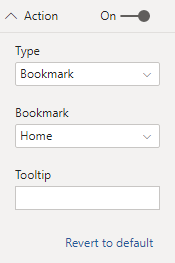
To indicate what page a user is currently on, tweak the format of the button representing the current page. In my example, I added a white background to the Home button on the Home report page.
To speed up the bookmark process, you could select all your now bookmarked buttons by holding CTRL and clicking. Then simply right click, copy and paste them to subsequent pages. You only need to tweak the background for the relevant button representing that page.
And your all done, whew! You now have a killer base file you can start your reports with efficiently. Your Power BI template file can evolve over time to include better layouts, more detailed information and better design!
If you want to download my example Power BI Template PBIX, PowerPoint and this guide, you can do so here.
For more Power BI tips, tricks and guides like this one sign up to our newsletter!