The November 2019 update for Power BI Desktop is here and it is a relatively quiet one for finance professionals. There is a new modern ribbon in preview which aligns Power BI with Microsoft Office a bit better as well as a number of new visuals added including an update for ArcGIS Maps which is a great tool for overlaying data on locations.
Here’s the complete list of November updates:
Other
- Modern ribbon (preview)
Reporting
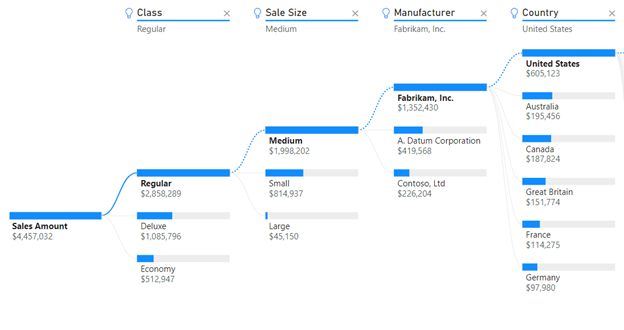
- Decomposition tree visual (preview)
Analytics
- Conditionally format button formatting
Visualizations
- ArcGIS Maps for Power BI update
- New xViz visuals
- Advanced Gauge
- Hierarchical Filter
- ZoomCharts Drill-Down Waterfall Visual
- Financial Reporting Matrix by Profitbase
- Distribution
- Tree
Data connectivity
- LinkedIn Sales Navigator connector
- Edit SAP variables experience now generally available
- Vena connector
- SiteImprove connector
- Product Insights connector
- Web By Example connector – support for extracting links
Data Preparation
- AI functions in Power Query (Preview)
Template apps
- LinkedIn Sales Navigator for Sales Operations
For a summary of the major updates, you can watch the following video.
For more Power BI updates head over to Microsoft’s official blog and sign up to our newsletter!