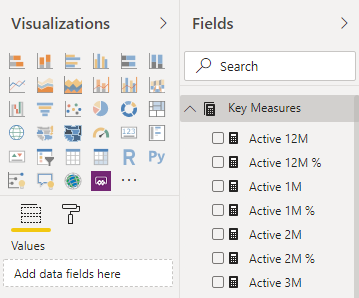
Ever create a Power BI report and struggled to find your measures? Here is a simple, best practice way to keep all your measures organised by keeping them in a separate table called a Measure Table.
Step 1
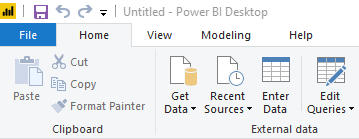
Open Power BI Desktop and click Enter Data.
Step 2
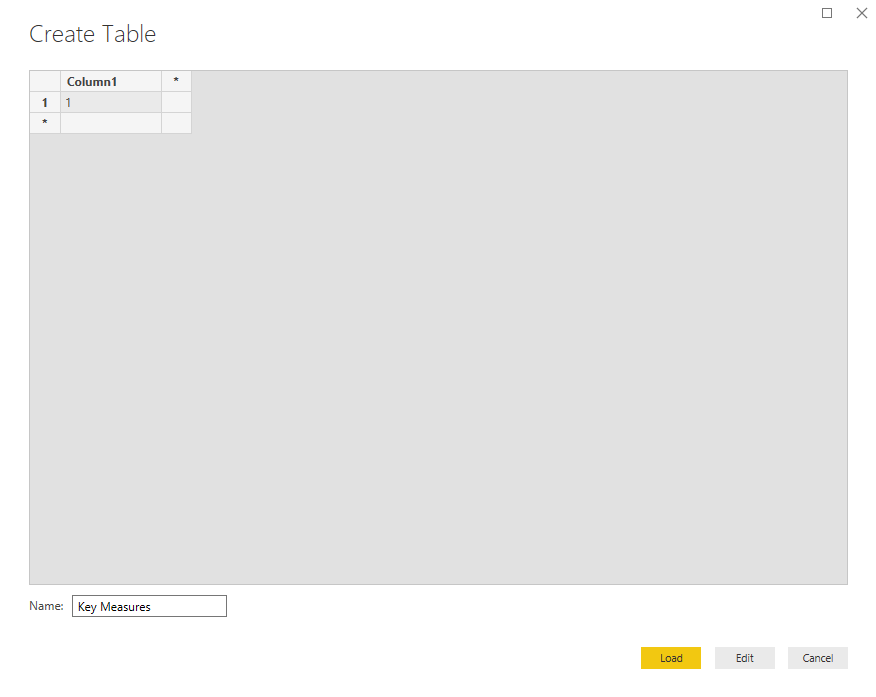
Enter in a value (eg 1) into the only cell, rename the the table to something descriptive like “Key Measures” and click Load.
Step 3
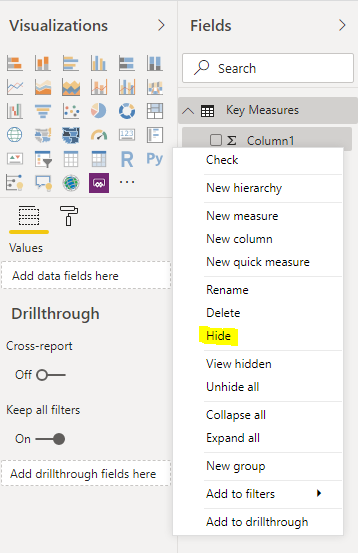
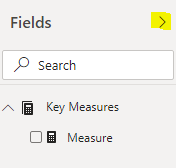
Under Fields and your new Key Measures table, right click on the value we created (Column1) and click hide. This will make the whole table disappear for now and there are no unhidden values.
Step 4
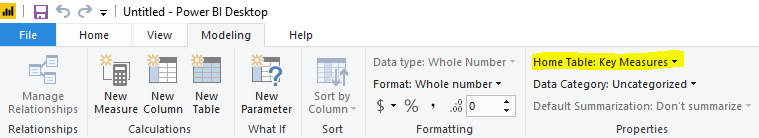
Create a new measure and select it under Fields. Once selected navigate to the Modelling tab along the top and ensure the Home Table is set to our new Key Measures table.
Step 5
Now that we have a Key Measures table with the only visible value being a Measure, all we need to do is collapse (click on little > in the top right) and reopen the Fields tab to reset the icon of our Key Measures table.
All done! For more Power BI tips & tricks sign up to our newsletter!